Ever wonder how many tickets you actually need to sell to stop losing money and start making a profit? It's a question a lot of businesses, especially those in entertainment or events, grapple with. Knowing this number isn't just about guessing; it's about understanding the core of your business's financial health. This article breaks down the concept of break-even analysis, showing you how to figure out that magic number so you can plan better and make smarter decisions.
Understanding the Core Components of Break-Even Analysis
So, you're trying to figure out how many tickets you actually need to sell to not lose money, right? It sounds simple, but there are a few moving parts. Understanding the core components of break-even analysis is like getting the ingredients right before you start baking. You can't make a cake without flour, sugar, and eggs, and you can't figure out your break-even point without knowing your costs and how much each sale contributes. Let's break it down.
Defining fixed costs in your business
Fixed costs are those expenses that pretty much stay the same, no matter how many tickets you sell or how busy your event is. Think of them as the baseline costs of just having the business or event ready to go. Rent for your venue, salaries for permanent staff, insurance policies, and even basic utilities like internet, these are all examples. They don't go up if you sell 100 tickets and they don't go down if you only sell 50. They are just there, a constant number you have to cover.
- Rent or Venue Hire
- Salaries (non-commission based)
- Insurance
- Utilities (base charges)
- Loan Payments
Identifying variable costs per unit
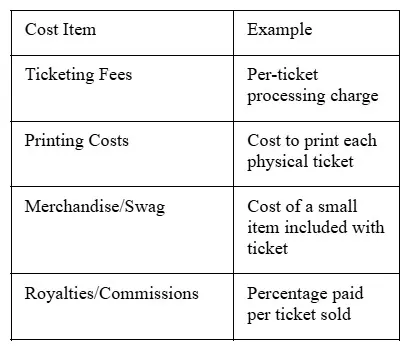
Now, variable costs are different. These costs change directly with every single ticket you sell. For each ticket sold, there's usually a cost associated with it. This could be the printing cost of the ticket itself, a small fee charged by the ticketing platform, or maybe a per person cost for a small party favor included with the ticket. If you sell more tickets, these costs go up. If you sell fewer, they go down. These are the costs directly tied to each individual sale.
Here’s a quick look:
Calculating the contribution margin
This is where things start to get interesting. The contribution margin is basically the money left over from the sale of one ticket after you've paid for the variable costs associated with that ticket. It’s the amount that each ticket sale contributes towards covering your fixed costs and, eventually, making a profit. To find it, you simply subtract the variable cost per ticket from the ticket price.
So, if your ticket price is $50 and the variable costs (like ticketing fees and printing) add up to $5 per ticket, your contribution margin is $45 ($50 - $5). This $45 is what’s available to pay for your rent, salaries, and everything else that’s a fixed cost. It’s a really important number because it tells you how much each sale is actually helping your bottom line.
Understanding these three components, fixed costs, variable costs per unit, and the contribution margin, is the absolute foundation for figuring out your break-even point. Get these wrong, and everything else will be off.
Calculating Your Break-Even Point in Units

So, you've got your fixed costs sorted and your variable costs figured out. Now comes the part where we actually figure out how many items you need to sell to stop losing money and start making it. This is where calculating your break-even point in units comes into play. It's a pretty straightforward concept, but it's super important for understanding your business's financial health.
The Formula for Break-Even Point in Units
At its core, the formula is designed to tell you exactly how many individual products or services you need to sell to cover all your costs. Think of it as the magic number that separates a losing month from a break-even one.
The formula looks like this:
Break-Even Point (Units) = Total Fixed Costs / (Sales Price Per Unit - Variable Cost Per Unit)
Let's break down what each part means:
- Total Fixed Costs: These are your costs that don't change no matter how many units you sell. We're talking rent, salaries, insurance, that sort of thing. You already figured these out in the last section
- Sales Price Per Unit: This is simply the price you charge for one of your products or services
- Variable Cost Per Unit: This is the cost directly associated with producing or delivering one unit of your product or service. Think materials, direct labor, or shipping for that specific item
Applying the formula with real world examples
Numbers make this much clearer, right? Let's imagine a small bakery that sells custom cakes.
- Fixed Costs: Let's say their monthly rent, utilities, and salaries add up to $4,000
- Sales Price Per Unit: They sell each custom cake for $50
- Variable Cost Per Unit: The ingredients, frosting, and packaging for each cake cost them $20
Now, let's plug these numbers into our formula:
Break-Even Point (Units) = $4,000 / ($50 - $20)
Break-Even Point (Units) = $4,000 / $30
Break-Even Point (Units) = 133.33
Since you can't sell a third of a cake, they'd need to sell 134 cakes to officially break even.
Here's another quick example, maybe for a freelance graphic designer:
- Fixed Costs: Monthly software subscriptions, office rent (if applicable), and internet cost $1,000
- Sales Price Per Unit: They charge $200 per logo design project
- Variable Cost Per Unit: The time spent on research and revisions, plus any stock assets used, averages out to $50 per project
Calculation:
Break-Even Point (Units) = $1,000 / ($200 - $50)
Break-Even Point (Units) = $1,000 / $150
Break-Even Point (Units) = 6.67
So, this designer needs to complete 7 logo projects each month to cover all their expenses.
Interpreting your break-even unit calculation
What does this number, like 134 cakes or 7 projects, actually mean for your business? It's your target. Selling fewer than this means you're losing money. Selling exactly this amount means you've covered all your costs but haven't made any profit yet. Every sale after you hit this number is pure profit. It gives you a clear, tangible goal to aim for each sales period. It helps you understand the minimum sales volume required to keep the lights on and the business running without taking a hit.
Determining Break-Even Point in Sales Dollars
So, we've talked about how many units you need to sell to hit that break-even point. But what about the actual money you need to bring in? That's where calculating your break-even point in sales dollars comes in. It's basically the flip side of the coin, showing you the total revenue required to cover all your costs, both fixed and variable.
Calculating break-even point in revenue
This calculation is pretty straightforward once you've got your numbers sorted. You'll use your total fixed costs and divide them by your contribution margin ratio. The contribution margin ratio is just the contribution margin per unit (selling price minus variable cost per unit) divided by the selling price per unit. It tells you what percentage of each sales dollar is left over to cover fixed costs and contribute to profit.
Here's the formula:
Break-Even Point (in Sales Dollars) = Total Fixed Costs / Contribution Margin Ratio
Let's say your fixed costs are $10,000 a month. Your product sells for $50, and the variable cost to make it is $20. Your contribution margin per unit is $30 ($50 - $20). The contribution margin ratio would be $30 / $50 = 0.6, or 60%.
So, your break-even point in sales dollars would be $10,000 / 0.6 = $16,666.67. This means you need to bring in $16,666.67 in total sales to cover all your expenses.
Understanding the significance of sales dollars
Knowing your break-even point in dollars is super helpful for a few reasons. It gives you a clear revenue target. Instead of thinking about selling, say, 500 widgets, you can think about needing to generate $25,000 in sales. This can be easier to track and communicate to your sales team. It also helps you understand the overall financial health of your business at a glance. If your current sales are consistently below this dollar amount, you know you're operating at a loss.
Comparing unit vs. dollar break-even points
Both calculations are important, but they tell you slightly different things. The break-even point in units tells you the volume of sales needed. The break-even point in dollars tells you the revenue needed. For businesses with a single product, these are closely related. But if you sell multiple products with different price points and variable costs, the dollar amount becomes more significant. It accounts for the mix of products you're selling. For example, selling 100 units of a high-priced item might get you to break-even faster in dollars than selling 200 units of a lower-priced item, even if both have a similar contribution margin per unit.
It's important to remember that these calculations are based on assumptions. If your costs change or your sales mix shifts significantly, your break-even point will also change. Regularly revisiting these numbers is key to staying on track.
Leveraging Break-Even Analysis for Strategic Decisions